SP500 LDN TRADING UPDATE 2/3/26

SP500 LDN TRADING UPDATE 2/3/26
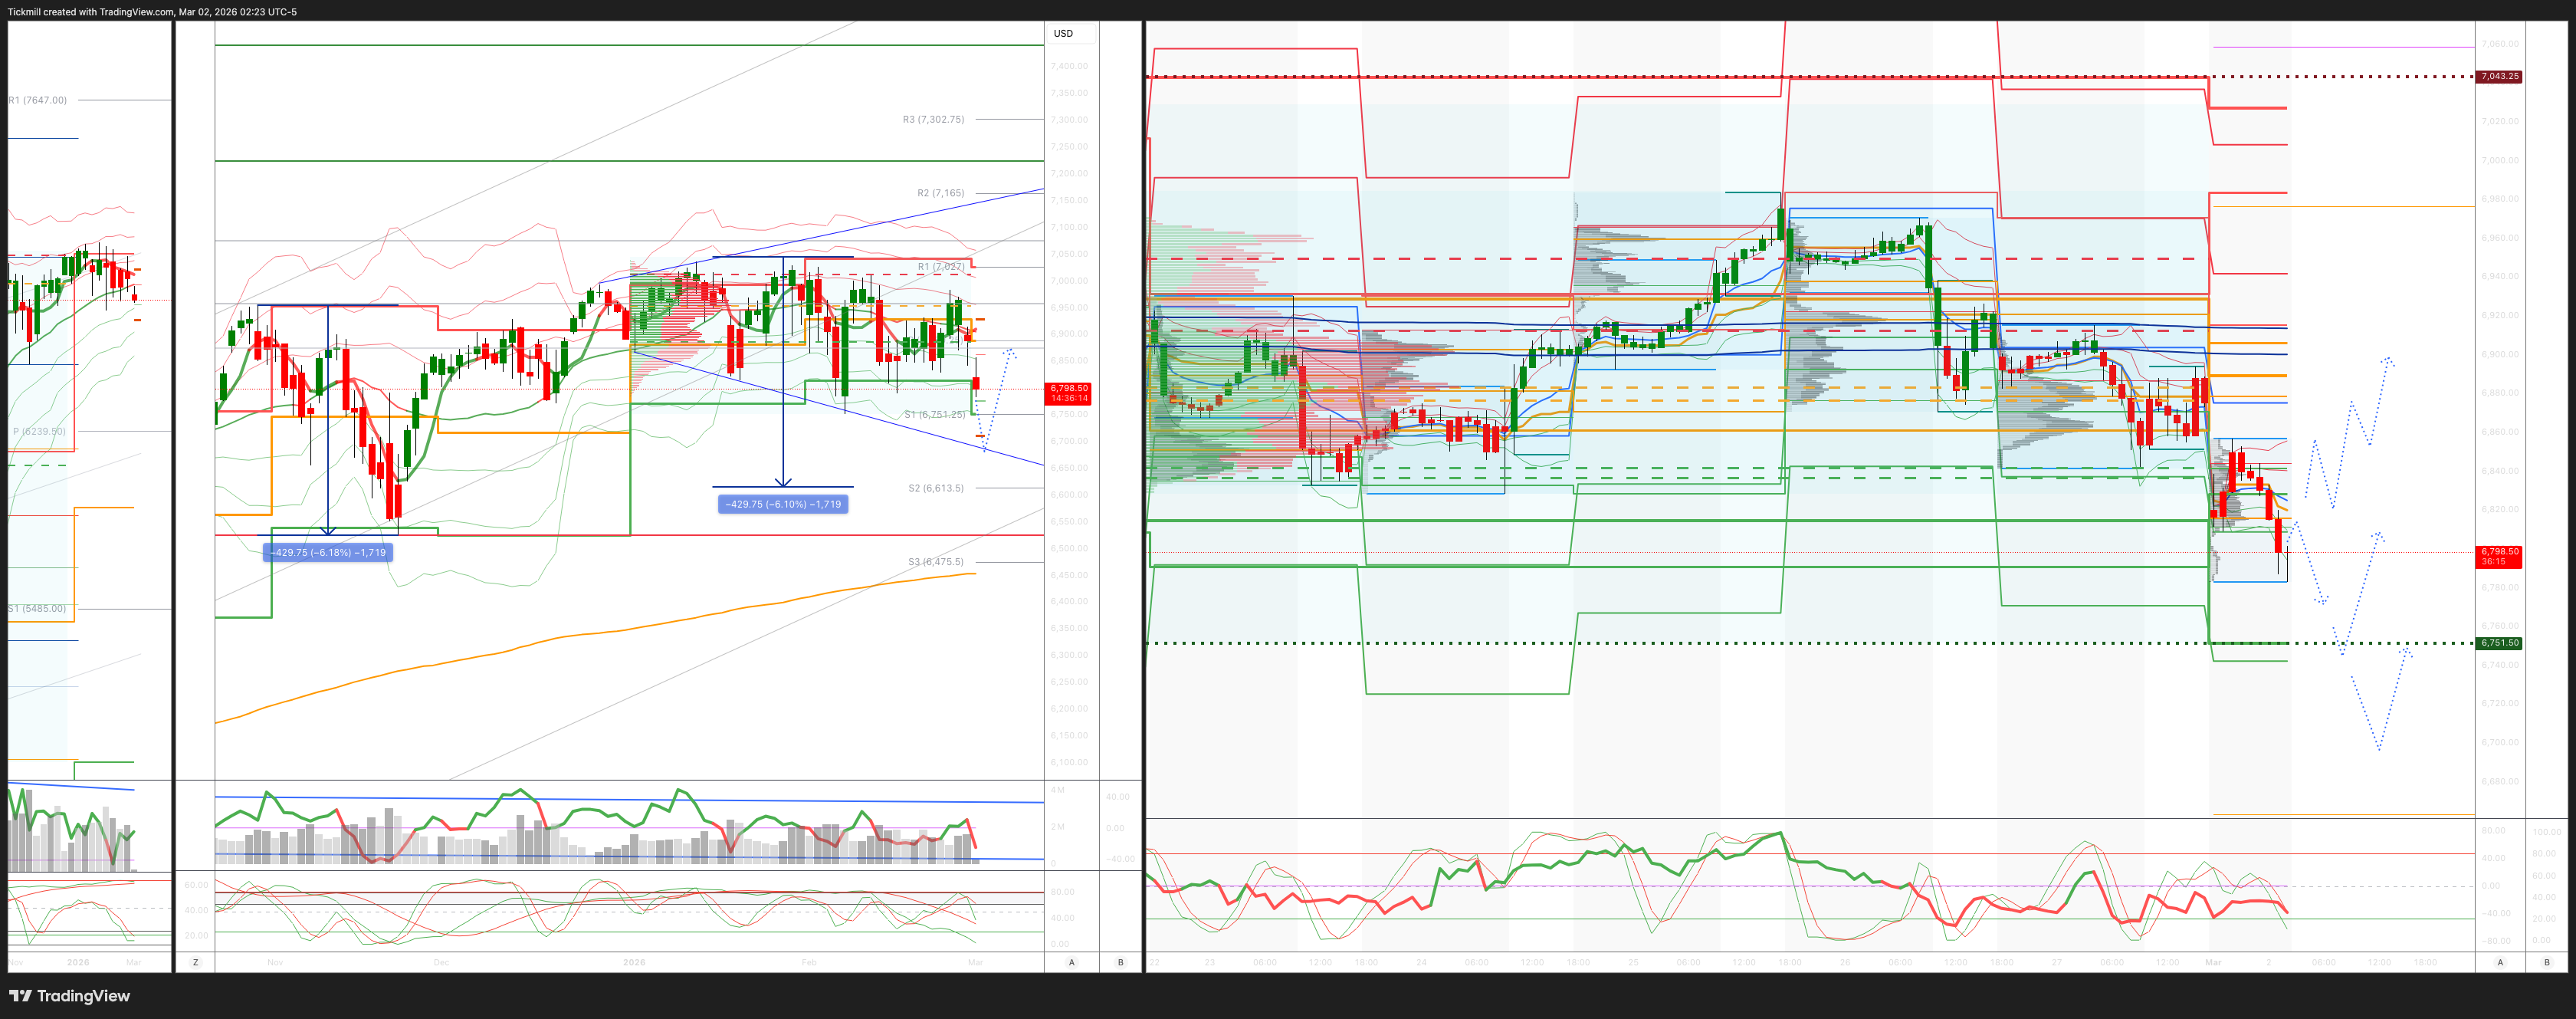
WEEKLY & DAILY LEVELS
***QUOTING ES1! FOR CASH US500 EQUIVALENT LEVELS, SUBTRACT POINT DIFFERENCE***
WEEKLY BULL BEAR ZONE 6940/50
WEEKLY RANGE RES 7031 SUP 6745
Weekly Straddle Range: 143 -point straddle implies a weekly range of [6745, 7031]; monitor 1.5x and 2x moves for key reactions.
March OPEX Straddle: 232.8-point range suggests OPEX-to-OPEX movement between [6677, 7142].
March QOPEX Straddle: 368.55-point range projects [6466, 7203], based on December OPEX.
March EOM Straddle: 255.4-point straddle indicates a monthly range of [6623, 7101]. .
DEC2025 to DEC2026 OPEX straddle spans 945 points, outlining a range of [5889, 7779]."
DAILY VWAP BEARISH 6893
WEEKLY VWAP BEARISH 6917
MONTHLY VWAP BEARISH 6893
DAILY STRUCTURE – BALANCE - 6965/6828
WEEKLY STRUCTURE – BALANCE - 7031/6791
MONTHLY STRUCTURE - BALANCE - 7031/6775
Balance: This refers to a market condition where prices move within a defined range, reflecting uncertainty as participants await further market-generated information. Our approach to balance includes favouring fade trades at the range extremes (highs/lows) while preparing for potential breakout scenarios if the balance shifts.
One-Time Framing Higher (OTFH): This represents a market trend where each successive bar forms a higher low, signalling a strong and consistent upward movement.
One-Time Framing Lower (OTFD): This describes a market trend where each successive bar forms a lower high, indicating a pronounced and steady downward movement.
DAILY BULL BEAR ZONE 6806/16
GAMMA FLIP 6901
DAILY RANGE RES 6941 SUP 6808
2 SIGMA RES 7008 SUP 6742
VIX BULL BEAR ZONE 20
PUT/CALL RATIO 2.66 (The numbers reflect options traded during the current session. A put-call ratio below 0.7 is generally considered bullish, and a put-call ratio above 1.0 is generally considered bearish)
TRADES & TARGETS
LONG ON REJECT/RECLAIM WEEKLY/2SIG RANGE SUP TARGET 6806/08
SHORT ON REJECT/RECLAIM 6806/08 TARGET WEEKLY RANGE SUP
(I FADE TESTS OF 2 SIGMA LEVELS ESPECIALLY INTO THE FINAL HOUR OF THE NY CASH SESSION AS 90% OF THE TIME WHEN TESTED THE MARKET WILL CLOSE ABOVE OR BELOW THESE LEVELS)
GOLDMAN SACHS TRADING DESK VIEW - ‘Nowhere To Hide’
It’s a dynamic weekend with numerous developments to process.
February felt unusually long—starting with a single-stock tremor early in the month (AI-insulated vs. non-AI-insulated stocks), escalating to an index-level shake mid-month (put volatility skew hit decade highs, and VVIX surged), and ending with the first signs of a credit market tremor (CDX IG widened by 5 points, its sharpest move since last summer, with elevated put open interest). Of these, the credit concerns are the most troubling.
Investors continue to seek safety in a market offering little refuge. Index skew remains at multi-year highs, single-stock implied volatility is nearing levels last seen during the Global Financial Crisis (GFC), and open interest in credit ETF hedges has reached all-time highs. These indicators of fear and potential contagion are evident, yet retail investors remain unfazed. Daily commentary suggests retail demand is at record levels.
Trades: I’m aligned with the newly coined GS acronym, “HALO” (heavy assets, low obsolescence). A compelling note I read this week summarized the shift in market dynamics: “For two decades, the investing world favored asset-light over asset-heavy—software over shovels, code over copper—because winners scaled infinitely with minimal marginal costs. This trend is reversing rapidly.” Capital expenditures must flow somewhere, and companies with solid fundamentals will benefit. Ben Snider and team have shared excellent data and charts on this theme (link). The GSTHHAIR index from GIR highlights “asset-heavy” winners.
Market Updates:
1. Prime Brokerage (i): Selling in U.S. equities continues, with GS Prime reporting a second consecutive week of net selling. Hedge funds sold U.S. single stocks at the fastest pace since “liberation day.”
2. Prime Brokerage (ii): The flight to safety within equities persists and is becoming more selective. Healthcare and industrials were the only sectors with net buying this week, and they remain the only sectors with year-to-date demand in 2026—reflected in their elevated valuations.
3. Futures: For once, equity CTA data isn’t the primary focus. Instead, attention is on the bond market. Global CTA managers are expected to continue buying government bonds over the next week. Combined with potential “risk-off” flows, yields could overshoot to the downside.
4. Derivatives (i): Single-stock volatility remains elevated. The implied volatility spread through year-end indicates single stocks could be significantly more volatile than the index, reaching levels last seen in October 2008.
5. Derivatives (ii): For contrarian investors willing to bet on upside (a rare stance), the NDX 3-month -20% put fully funds a 3-month 10% call. This is the tightest call strike in four years (average is 13% out-of-the-money).
6. Derivatives (iii): As mentioned, fear in long/short books at the start of the month has spilled into the index and now into credit. CDX widened this week compared to VIX (chart). Historically, when CDX traded in the mid-50s, the SPX was significantly lower.
7. ETFs: Demand for RSP remains robust. Investors are looking to stay long equities without overexposure to the “Magnificent 7.” RSP AUM has surged nearly 30% over the past three months, now at $90 billion—roughly double the size of DIA.
Disclaimer: The material provided is for information purposes only and should not be considered as investment advice. The views, information, or opinions expressed in the text belong solely to the author, and not to the author’s employer, organization, committee or other group or individual or company.
Past performance is not indicative of future results.
High Risk Warning: CFDs are complex instruments and come with a high risk of losing money rapidly due to leverage. 69% and 73% of retail investor accounts lose money when trading CFDs with Tickmill UK Ltd and Tickmill Europe Ltd respectively. You should consider whether you understand how CFDs work and whether you can afford to take the high risk of losing your money.
Futures and Options: Trading futures and options on margin carries a high degree of risk and may result in losses exceeding your initial investment. These products are not suitable for all investors. Ensure you fully understand the risks and take appropriate care to manage your risk.
Patrick has been involved in the financial markets for well over a decade as a self-educated professional trader and money manager. Flitting between the roles of market commentator, analyst and mentor, Patrick has improved the technical skills and psychological stance of literally hundreds of traders – coaching them to become savvy market operators!